Status

Important

░░░░░░░░░░░░░░░░░░░░░░░░░░░░░░░░░░░░░░░░░░░░░░░░░░░░░░░░░░░░░ ░░░░░░░░░░░░░░░░░░░░░░░░░░░░░░░░░░░░░░░░░░░░░░░░░░░░░░░░░░░░░

The status information is currently unavailable.

░░░░░░░░░░░░░░░░░░░░░░░░░░░░░░░░░░░░░░░░░░░░░░░░░░░░░░░░░░░░░ ░░░░░░░░░░░░░░░░░░░░░░░░░░░░░░░░░░░░░░░░░░░░░░░░░░░░░░░░░░░░░

Please note, that the actual status information is only accessible from within the institute network.

Interactive Servers

Current Status

The current usage of the processors (upper part) and of the main memory (lower part) is shown for all interactive servers at the following dashboard:

Compute Server Status

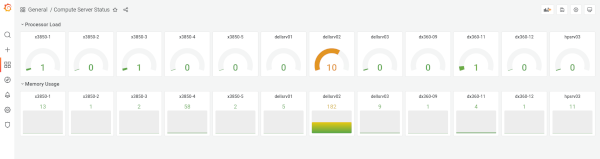
There, the load is the number of currently active jobs. The memory numbers are in GB.
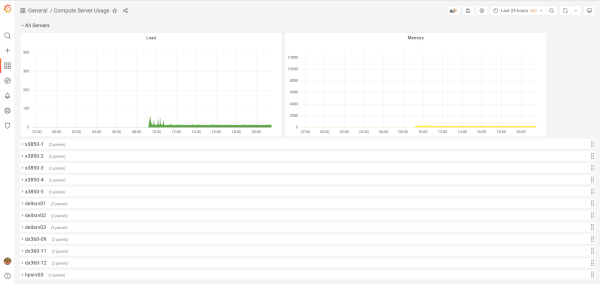
Usage History

You can also look at the usage of each compute server for (up to) the last year at the dashboard:

Compute Server Usage

Batch Servers

The usage of batch servers is shown per queue in the following dashboard:

Batch Server Usage